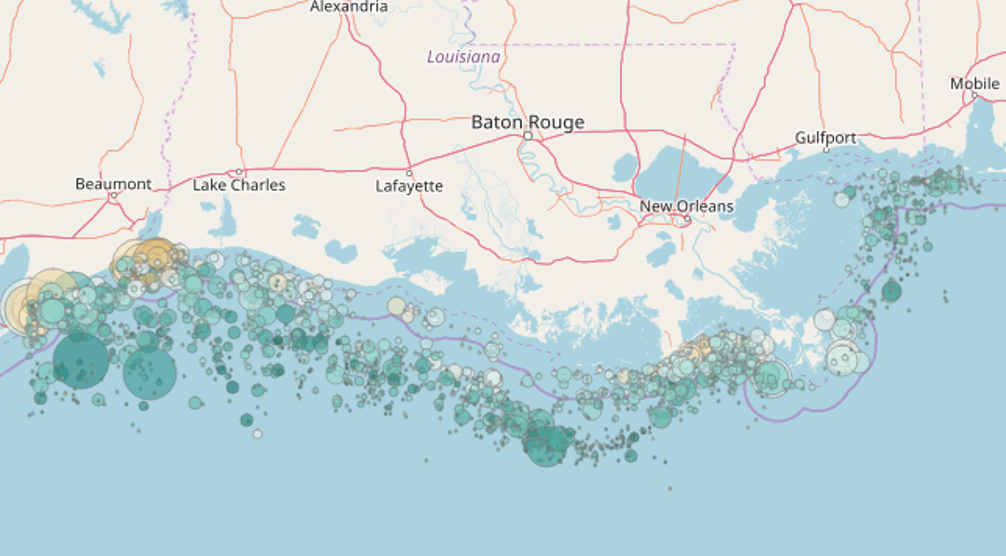
The gif below shows monthly distribution of Gulf menhaden biomass in log of metric tonnes per square kilometer from the SEAMAP data set for 2000-2016. Spatial interpolation was performed in R using kriging. Not all months were sampled on a consistent basis.
This gif shows Gulf of Mexico white shrimp biomass from the SEAMAP data set for 2000-2016. Not all months were sampled on a consistent basis.
The below gif shows bottom dissolved oxygen (mg/L) from SEAMAP stations from 2000-2016.
Visualizations by Cassie Glaspie: